I am currently conducting a research project using O-SNAP bottom-mounted ADCPs to detect and track icebergs, zooplankton, and sea ice.
O-SNAP is an international project to record water properties across the subpolar North Atlantic. They operate a mooring array off the coast of eastern Greenland, which holds bottom-mounted Acoustic Doppler Current Profilers, instruments that take advantage of Doppler shift properties to record current motion, as well as the distance between the sensor and the surface. Since the ADCPs are mounted to the seafloor looking upwards, the 'bottom' is, in this case, actually the sea surface, thus the distance recorded can change slightly when sea ice is present, or significantly when an iceberg passes overhead. Meanwhile, zooplankton activity will disrupt the signal throughout the water column, producing a distinct seasonal cycle corresponding to zooplankton populations.
I am working on this project as a personal research course for academic credit, supervised by Polar Center members Fiamma Straneo, James Holte, and Tiago Bilo. Read below for a breakdown of my preliminary steps in the project:
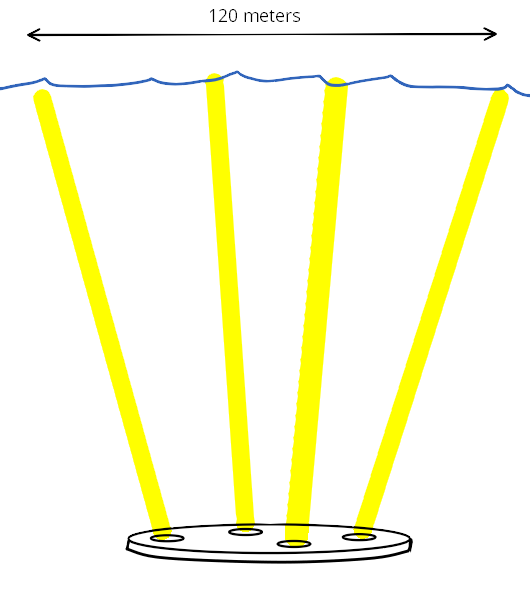
Beam Footprint
ADCPs have 4 beams pointing in the same direction, but each angled 20 degrees away from the true vertical axis. Hence, it has a 'footprint' on the surface, a circular area that it can measure, which depends on the beam angles, the depth, and the tilting of the instrument. I solved for the instrument footprints for moorings CF 1-3 to be circles with diameters about 120 m. From this, we can reasonably infer that an iceberg detected by all four beams simultaneously would have a size roughly corresponding to that footprint.
Pitch and Roll Corrections
Pitch (tilting forward and back) and roll (tilting left and right) have a small effect for bottom-mounted ADCPs which remain mostly stationary. Nonetheless, I accounted for pitch and roll using methodology described in a technical report (Woodgate & Holroyd, 2011) and found footprint diameter differences of about half a meter. Similarly, range measurements changed slightly, but the standard deviation between each beam's mean range was reduced by up to 40-70%, a significant improvement in consistency. Ideally, each beam would record exactly the same mean. Reducing standard deviation also improves the clarity and correlation of spiking patterns, which (as explained below) are key to identifying ice presence.
Range Analysis
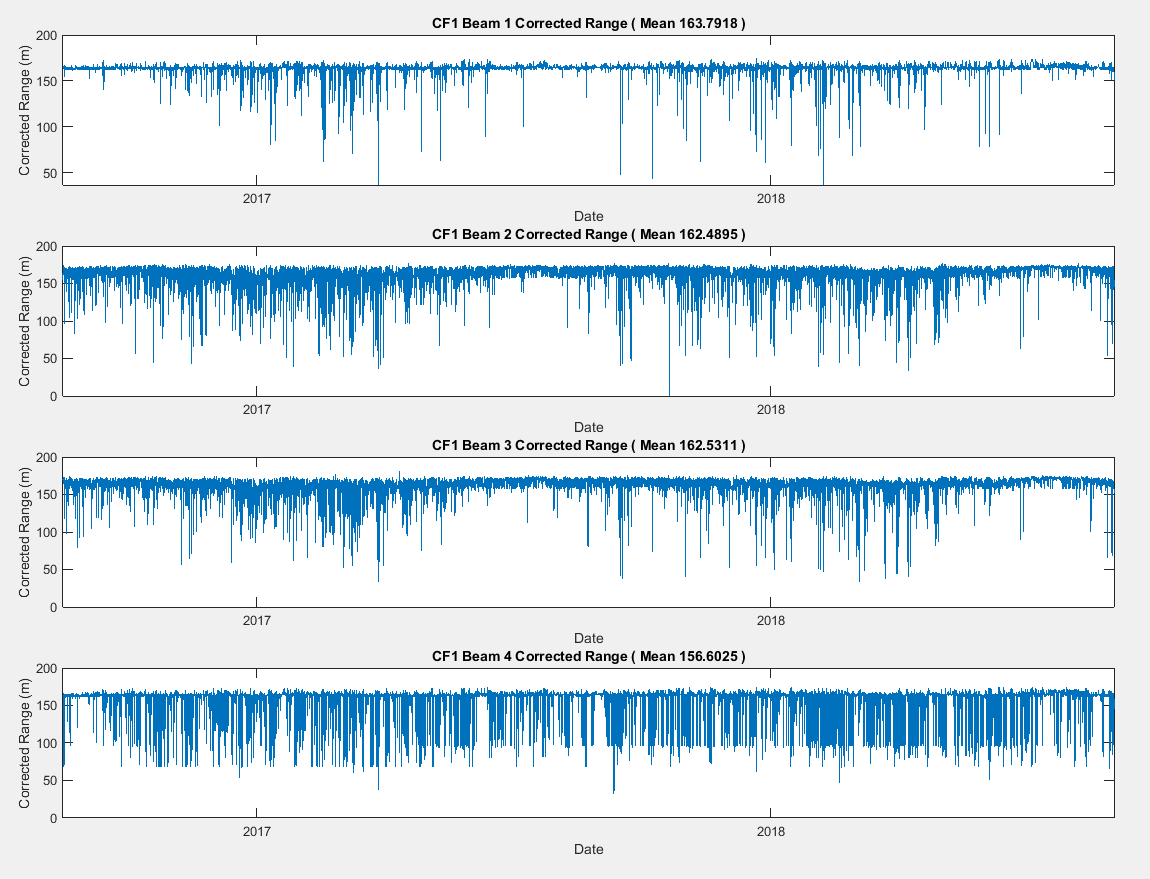
I am comparing all four beams to identify possible areas where icebergs may be passing overhead. I am looking for a way to index for the positions where all four beams, or at least three, experience a spike simultaneously. Two such spikes are visible here in 2017. ADCPs naturally have a lot of backscatter, so it is helpful to check that the hypothesized iceberg spikes match up with other evidence, such as satellite imagery.
If the method of checking for range spikes is viable, then it can open the door to various possible research applications - such as tracking iceberg frequency, size, movement, etc. with bottom-mounted ADCPs.
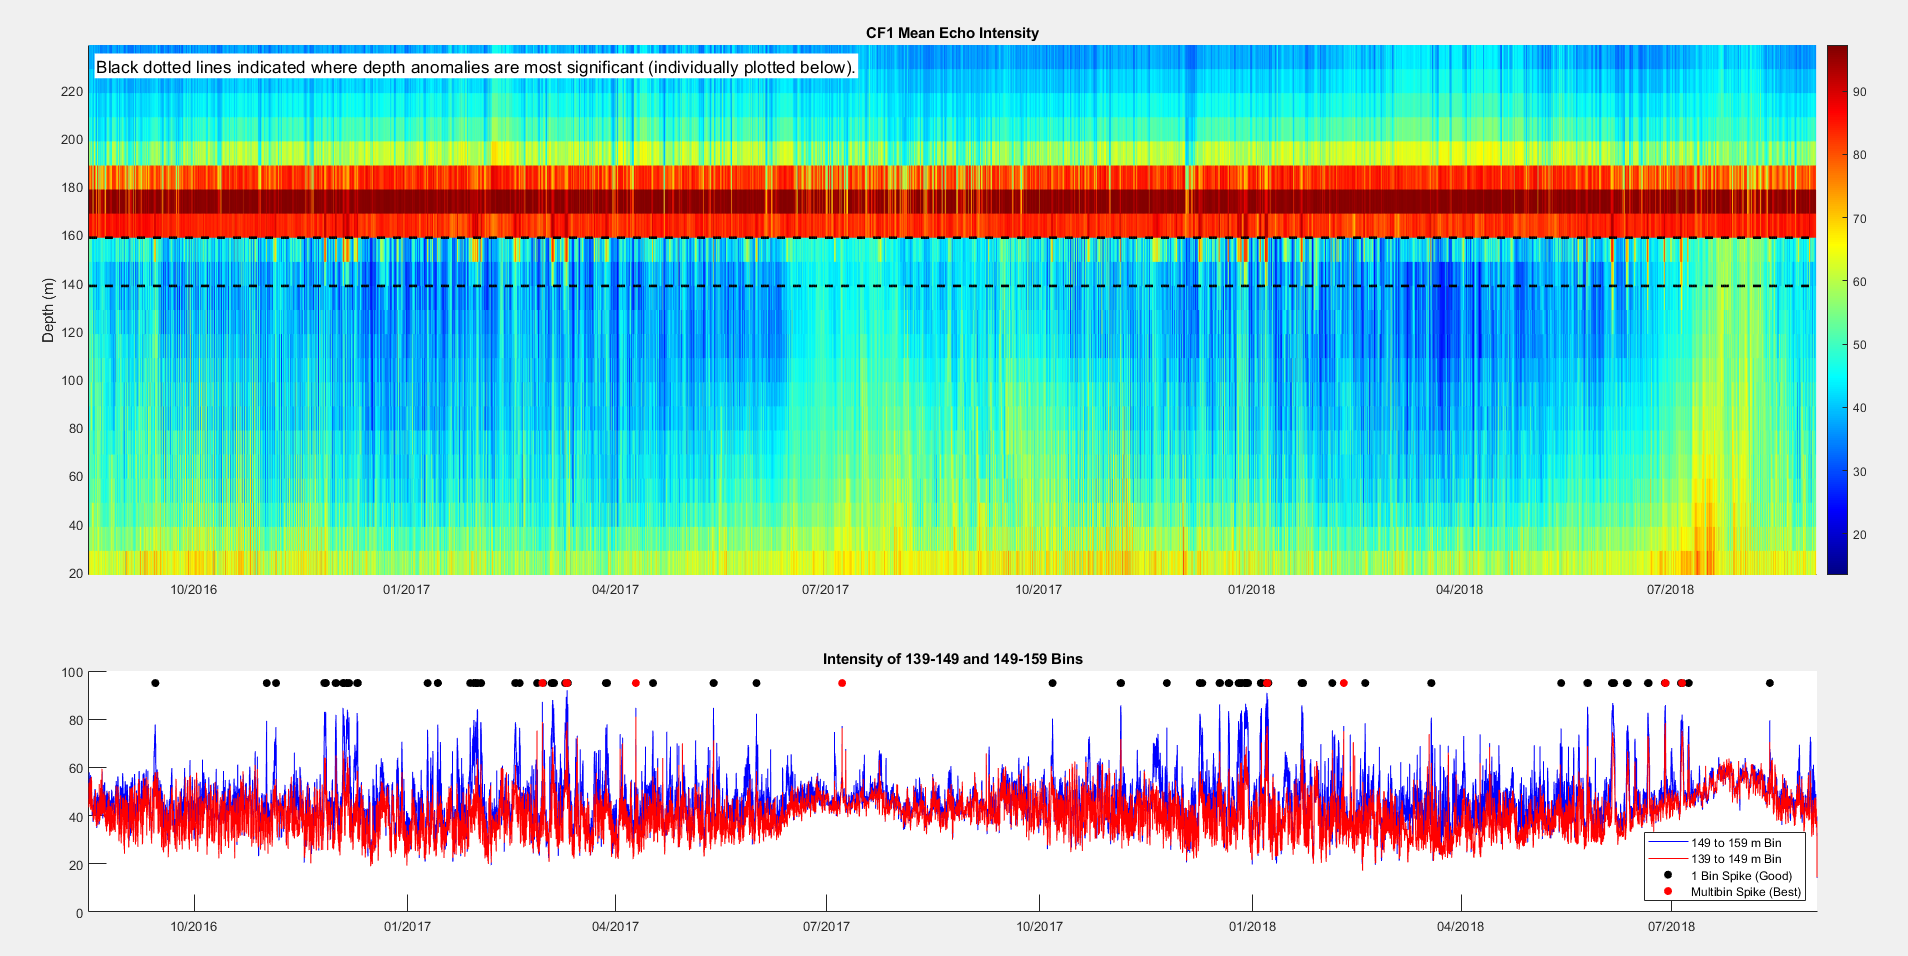
Below is a figure I produced looking for range spikes using the intensity measurements, which became the main dataset for the project. The intensity is the relative abundance of backscatter from the ADCP ping at different depths, which gives insight into what might be present in the water column. Most notably, the surface lies about 170 meters above the sensor, so it consistently has a high intensity - in addition, you can observe a seasonal cycle where the water column becomes more disturbed during the summer months, as sunlight and water temperatures allow zooplankton to flourish. Other researchers have observed zooplankton with ADCP backscatter before (Chereskin & Tarling, 2007). Spikes are visible as the relatively few sections of high intensity below the surface, within the two black dotted lines noted on the figure, although some penetrated to greater depths. Those two bins are individually plotted below, with black dots indicating a spike and red dots indicating major spikes where both bins register a high intensity - a good indication of a potential object in the water.
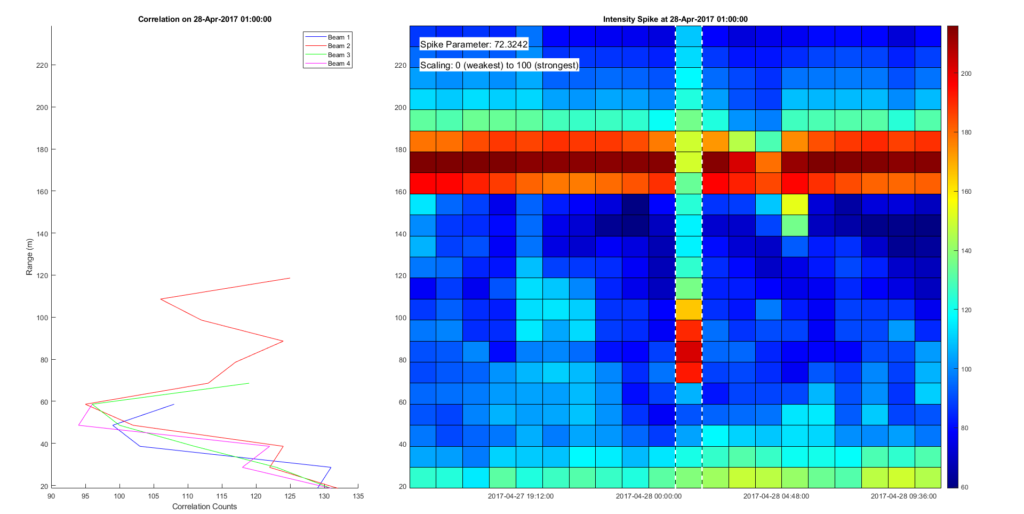
After analyzing the two bins above, we included a longer dataset and focused on potential iceberg signatures that reached even deeper below the surface - sometimes up to 100 meters or more. I combined the beam backscatter intensity data from three consecutive deployments, producing an uninterrupted time series from 2014 to 2020. I created an algorithm that searches for major iceberg spikes, and assigns them a value proportional to their depth and their intensity, selecting for the points where the ADCP recognizes an object that extends deep below the water surface. Some of these spikes reflect icebergs that collided with the mooring, knocking OSNAP Microcat instruments down to lower depths. Here are several spike patterns, showing the intensity signatures of large icebergs deep below the surface. The quality of the signature is graded by the "spike parameter" as labeled on the intensity plots.
(The x-axis is in hours - most spikes only register for one hour. Thus the figures don't necessarily represent the shape of the iceberg, but they do reflect how long the iceberg floated over the sensor. Unfortunately the low resolution in time means that many icebergs probably pass over the sensor without being recorded at all!)
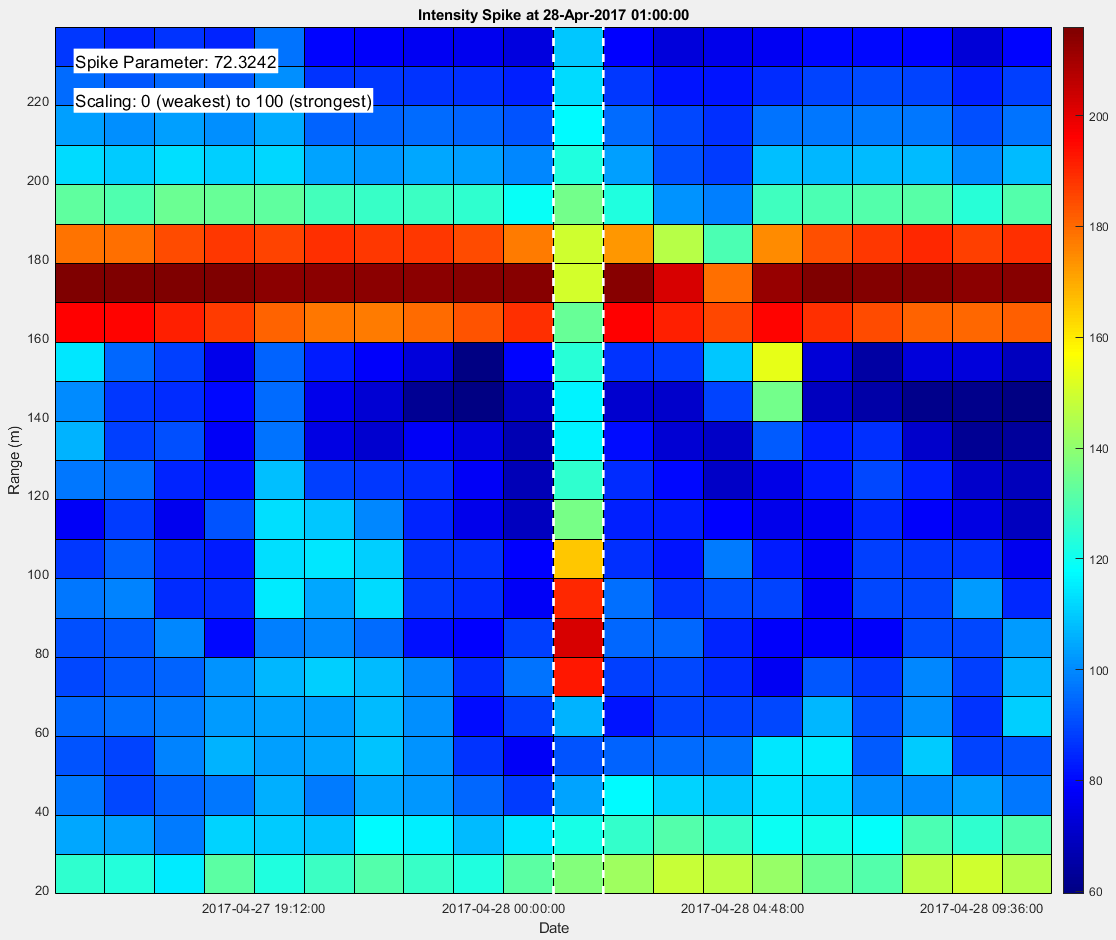
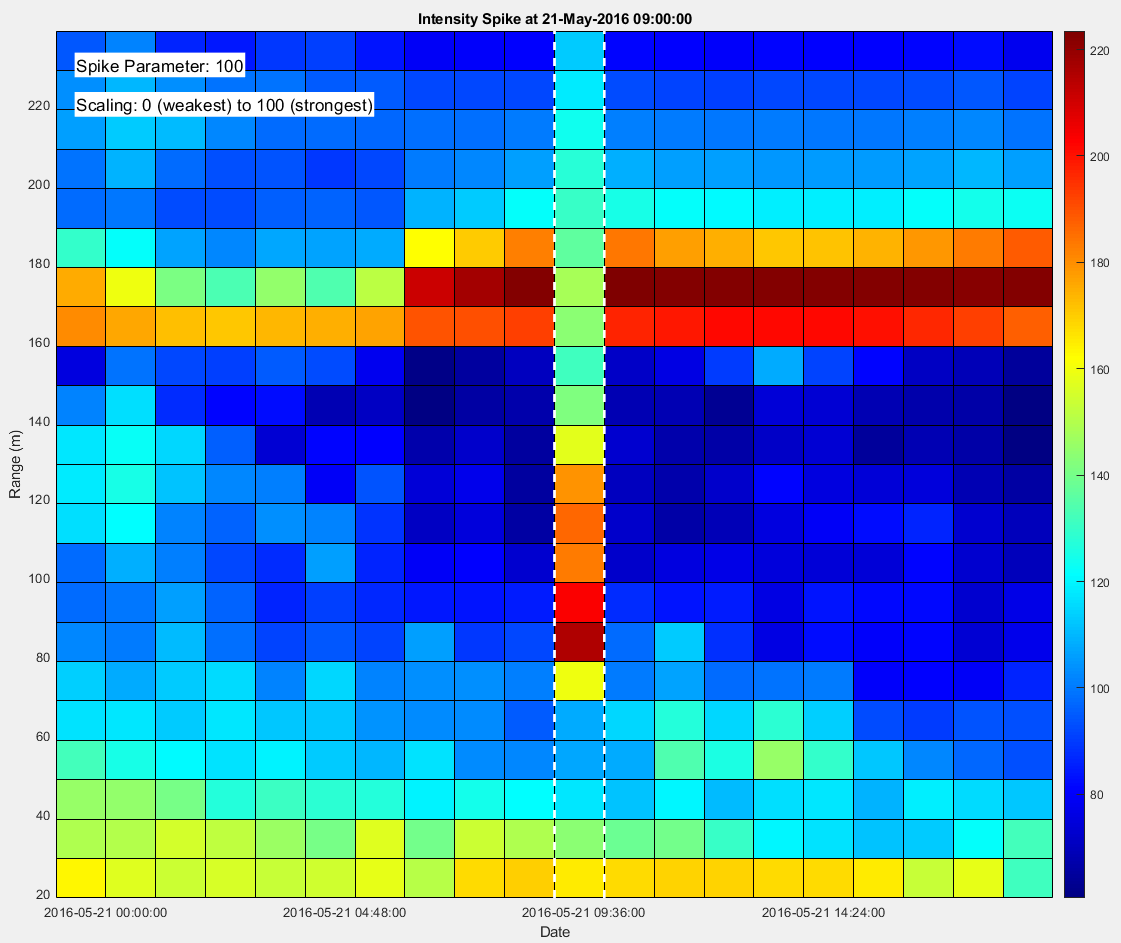
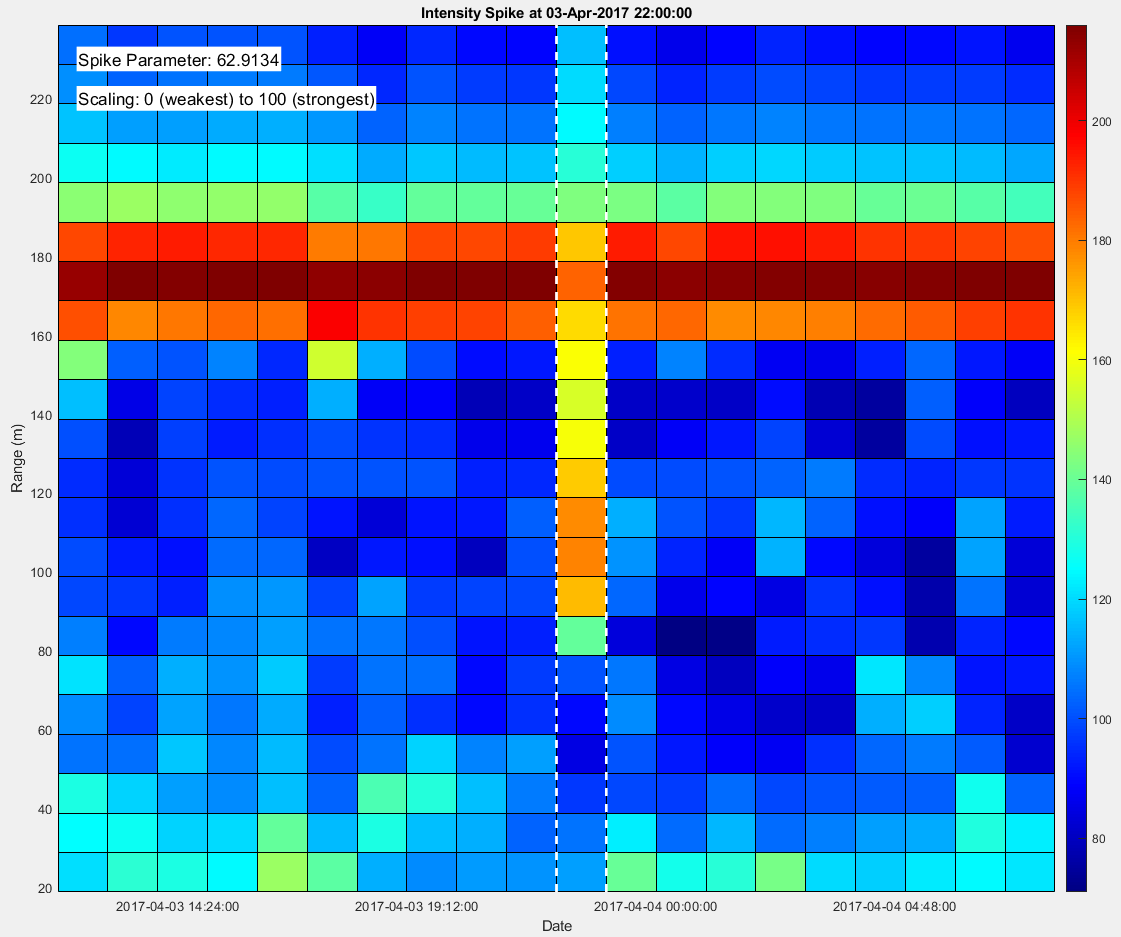
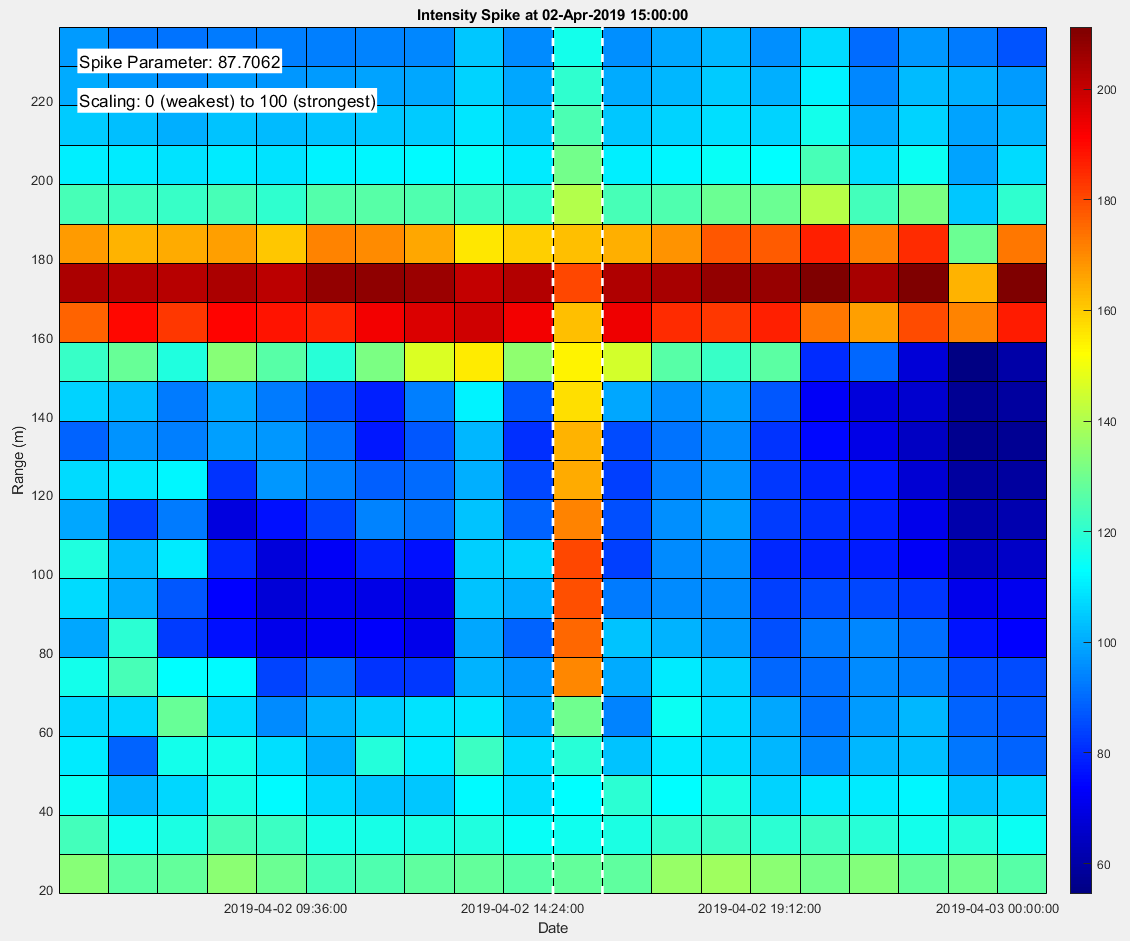
Now that we've identified various spikes like the ones above, the next step of the project is to refine our understanding of the results. We are collaborating with other researchers to identify where and when the icebergs travel over the moorings, in order to confirm their presence at the date and times the ADCP observes spikes. We are also interpreting the shallower, more persistent signatures as a sea ice floe, which might float above the sensor for hours or days at a time, poking only a few meters below the surface. Furthermore, we can compare our zooplankton patterns with in-situ observations to quantify the biomass present. Once the project is complete, it will most likely involve a combination of ADCP data analysis, current research on Greenland coastal ocean dynamics, remote sensing of sea ice, and iceberg tracking products.