
Source: NASA
Sermilik Fjord is a large fjord located in East Greenland. It's been studied closely by glaciologists, oceanographers, and climate scientists because of its size and access to numerous outlet glaciers from the rapidly declining Greenland Ice Sheet.
From 2008 to 2019, the Straneo Lab and colleagues have surveyed water conditions with near-annual expeditions. Data has been collected from several sources: 1-2 year mooring deployments, CTD casts, and XCTDs in northern areas where floating ice is abundant.
During summer 2020, I have taken on the task of organizing and standardizing these data, with the end goal to make them publicly available for use in research projects. Here are some of my tasks from the project:
Maps
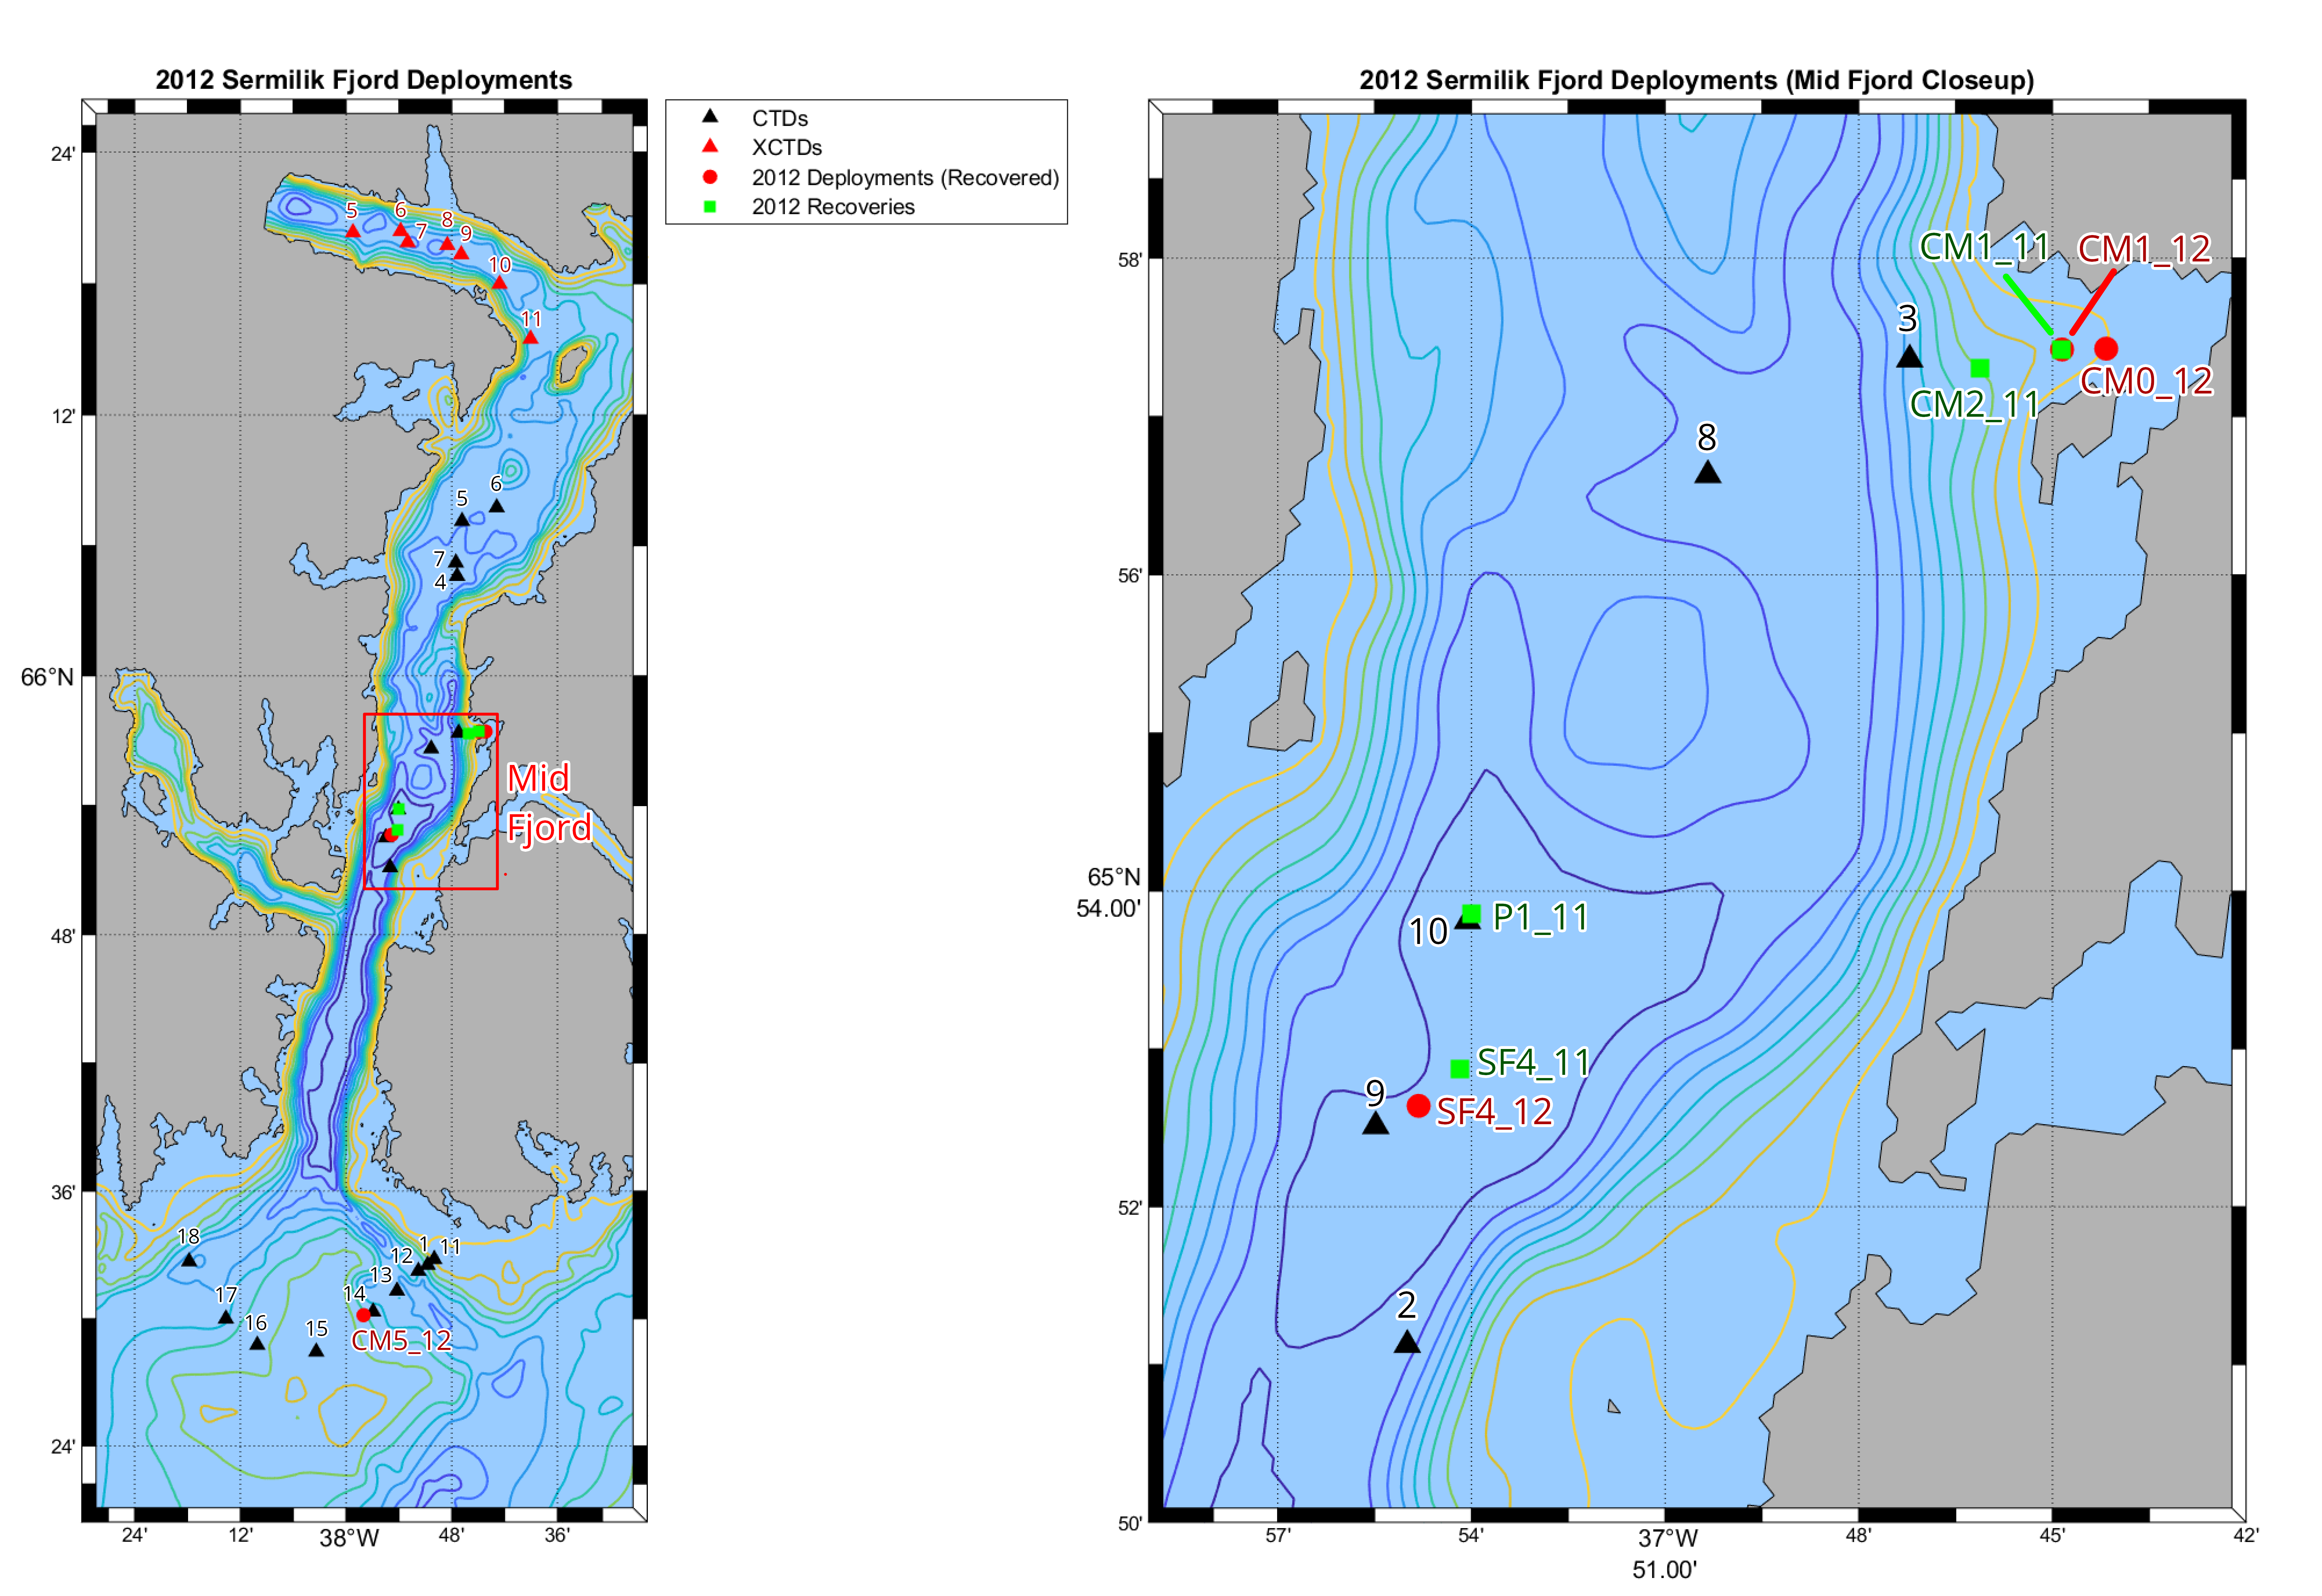
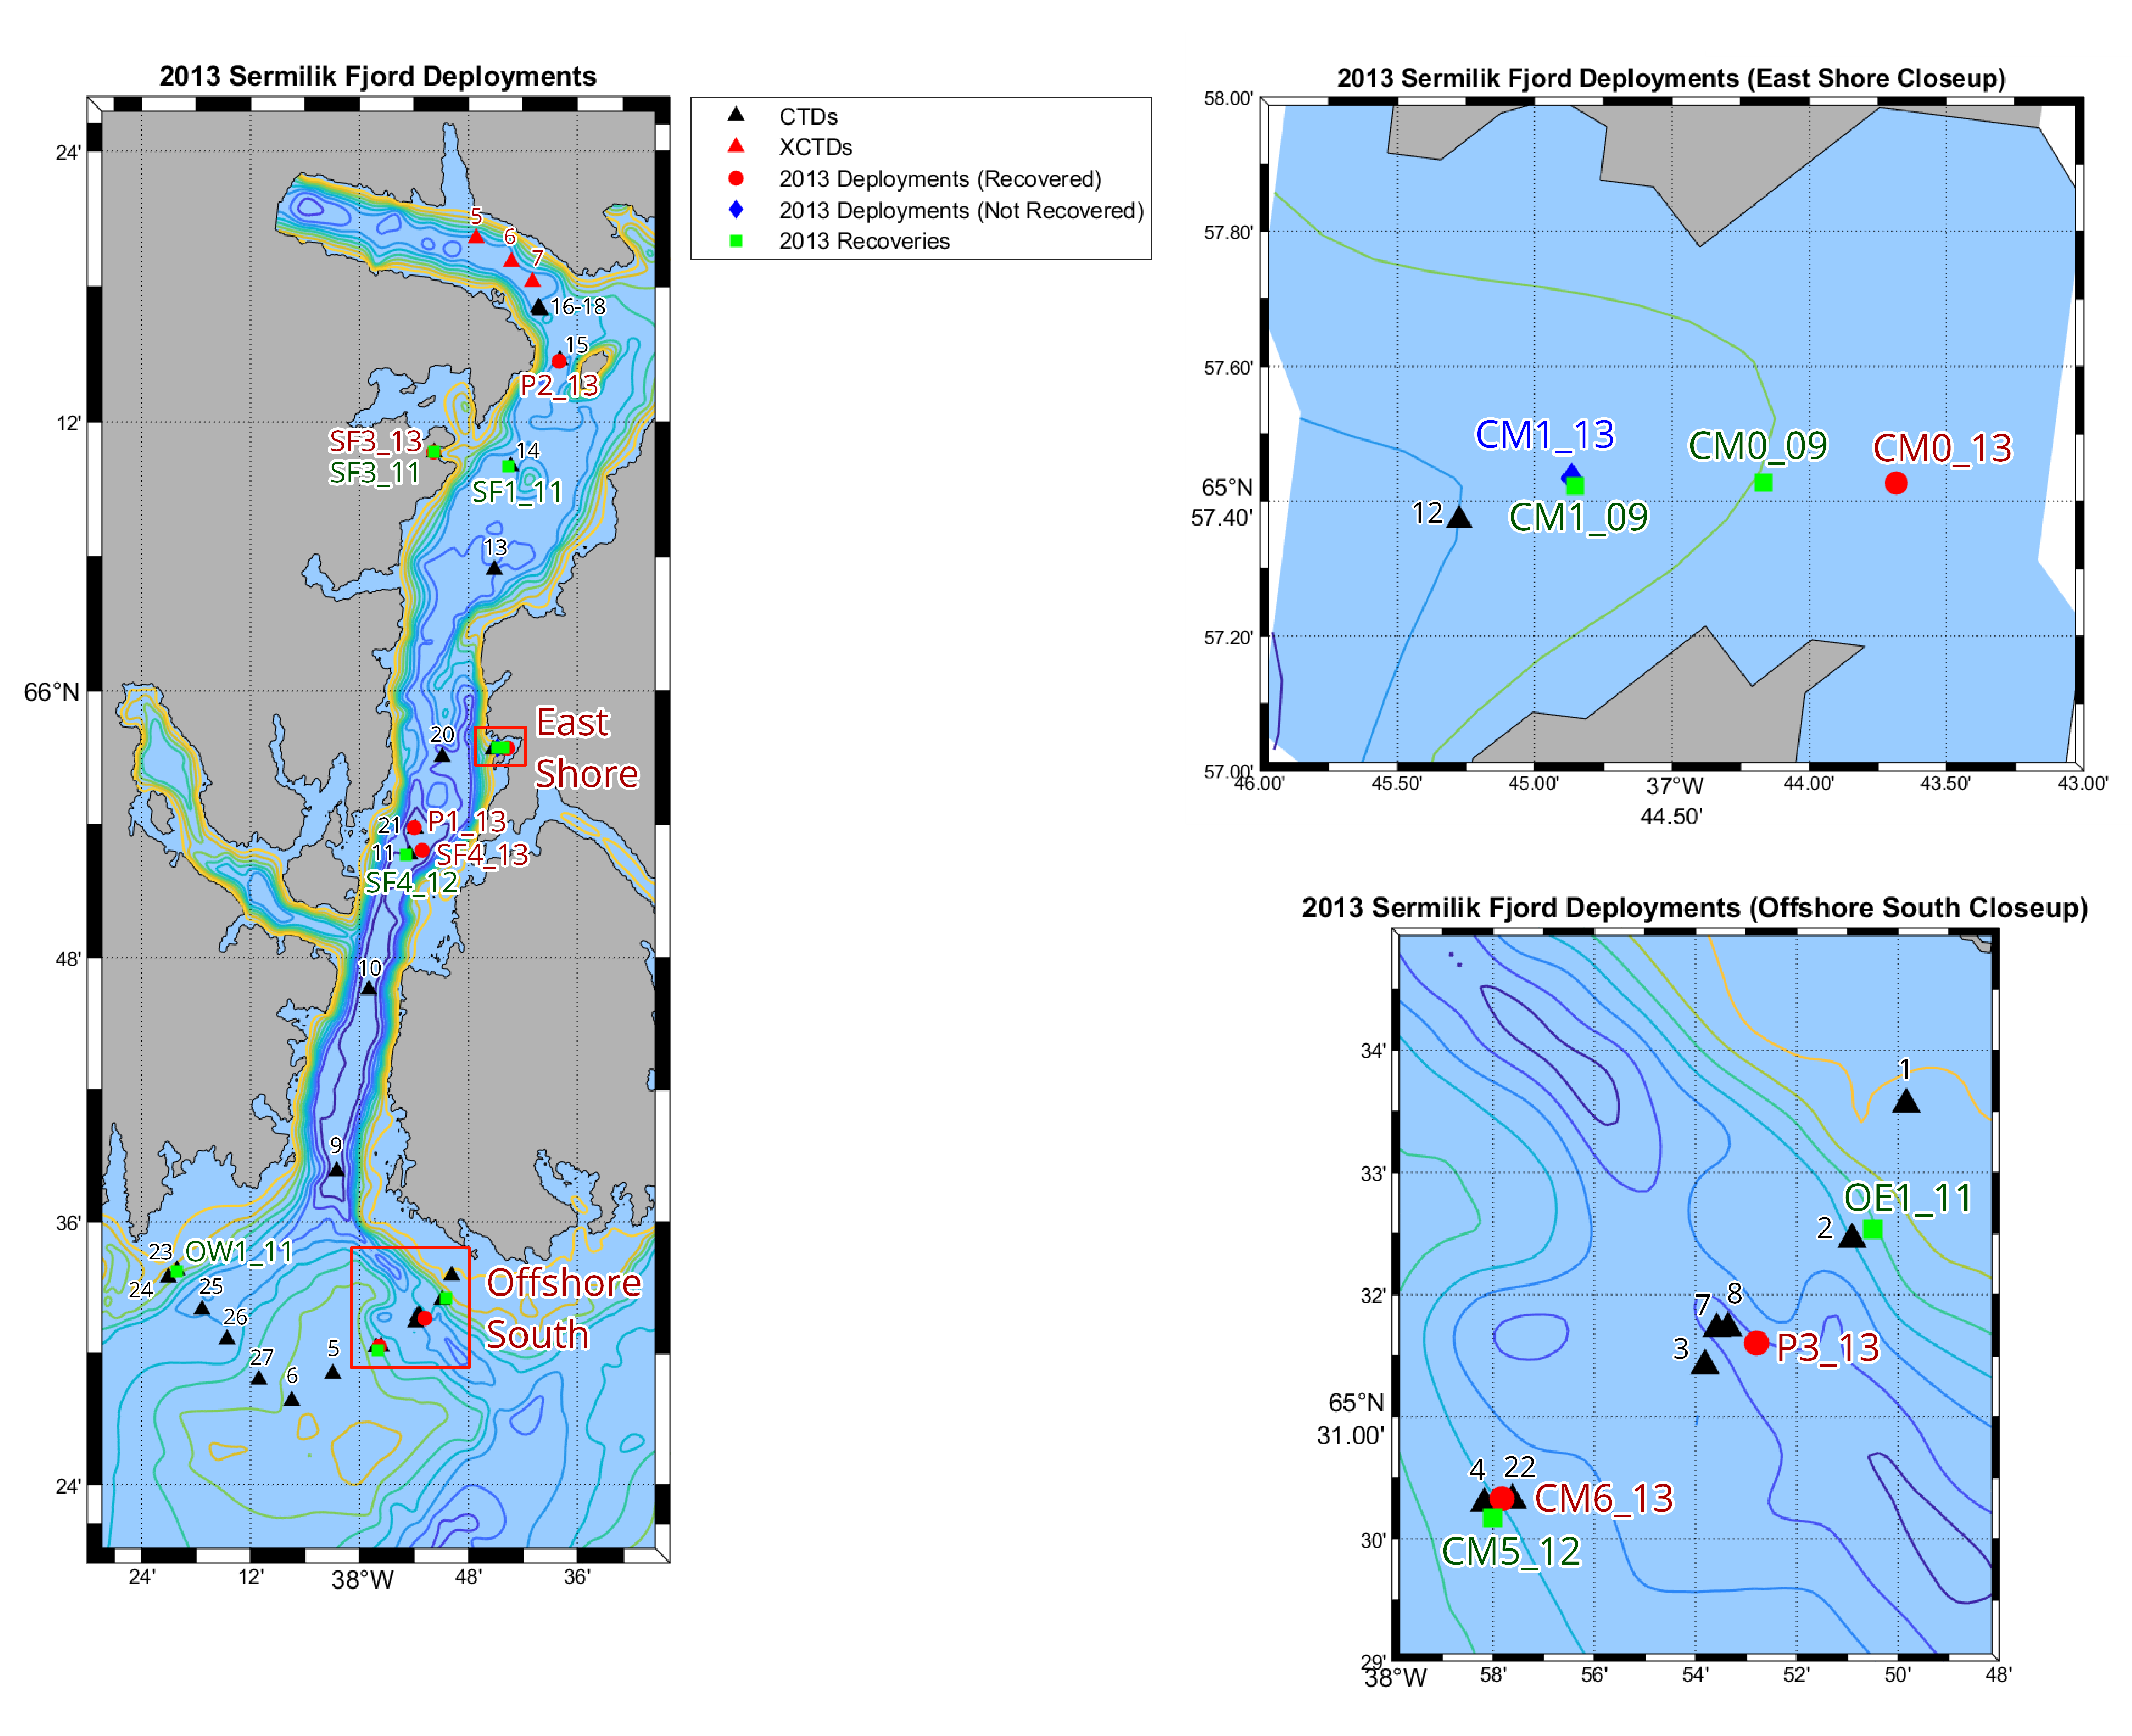
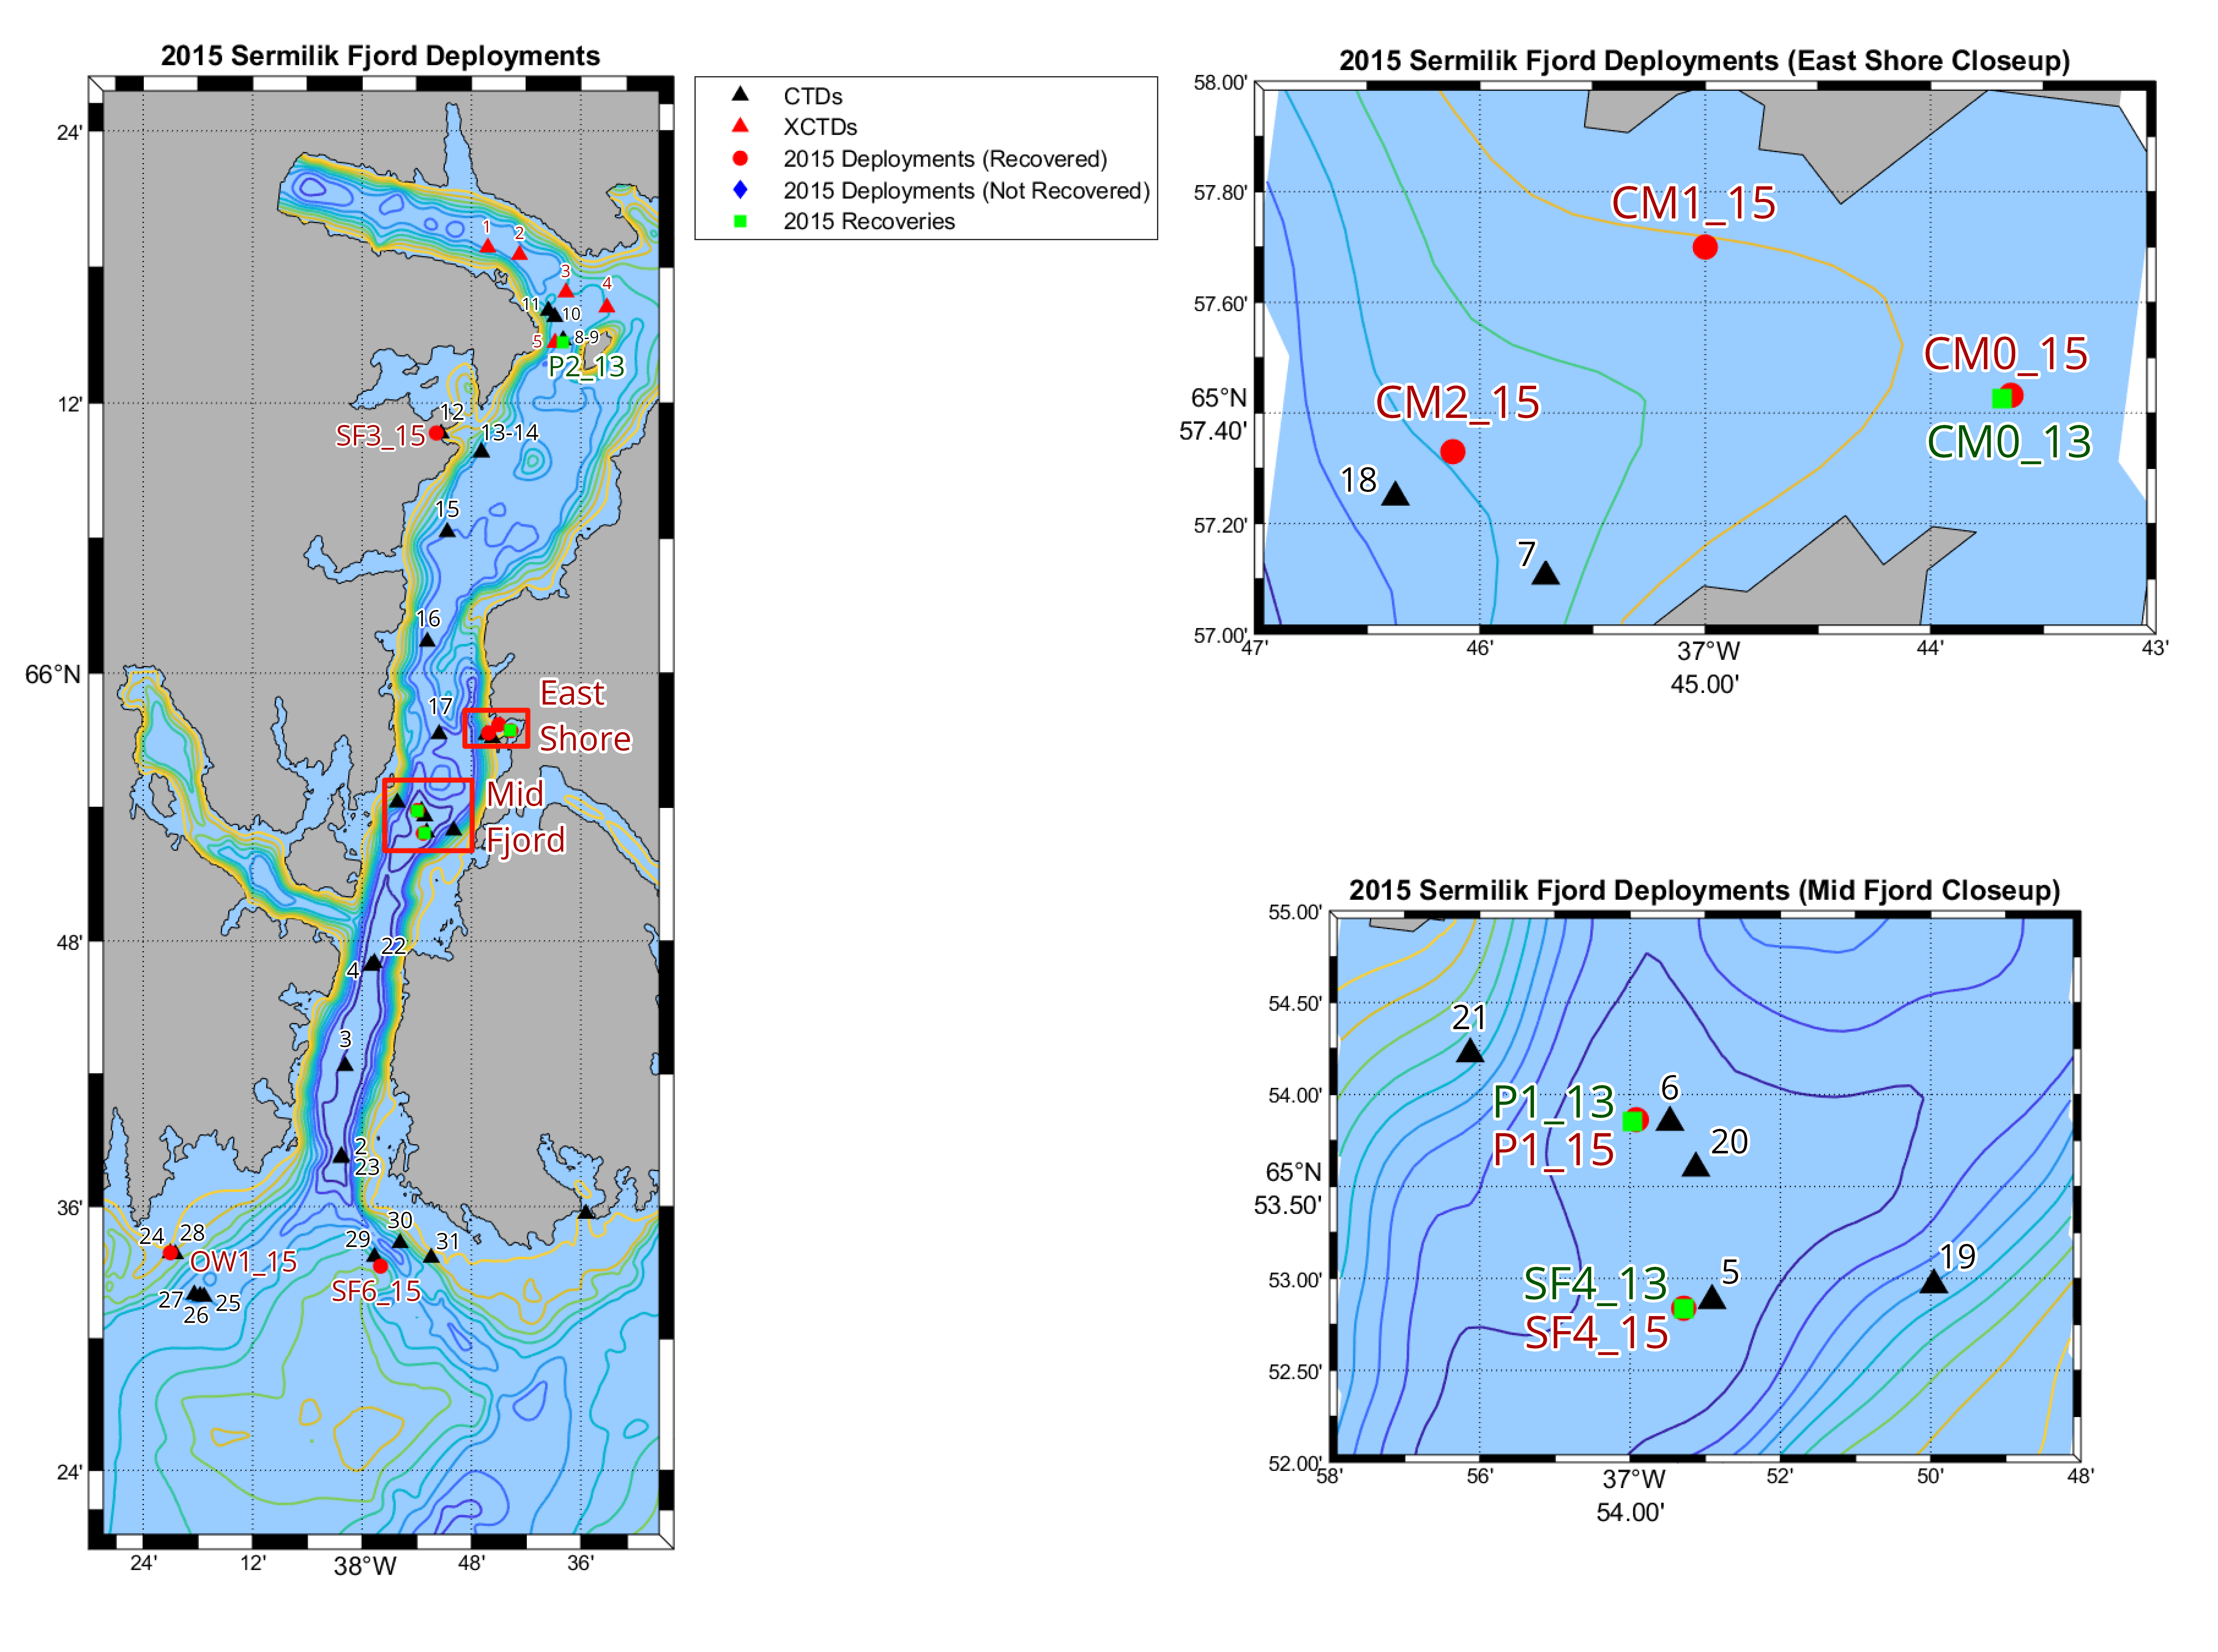
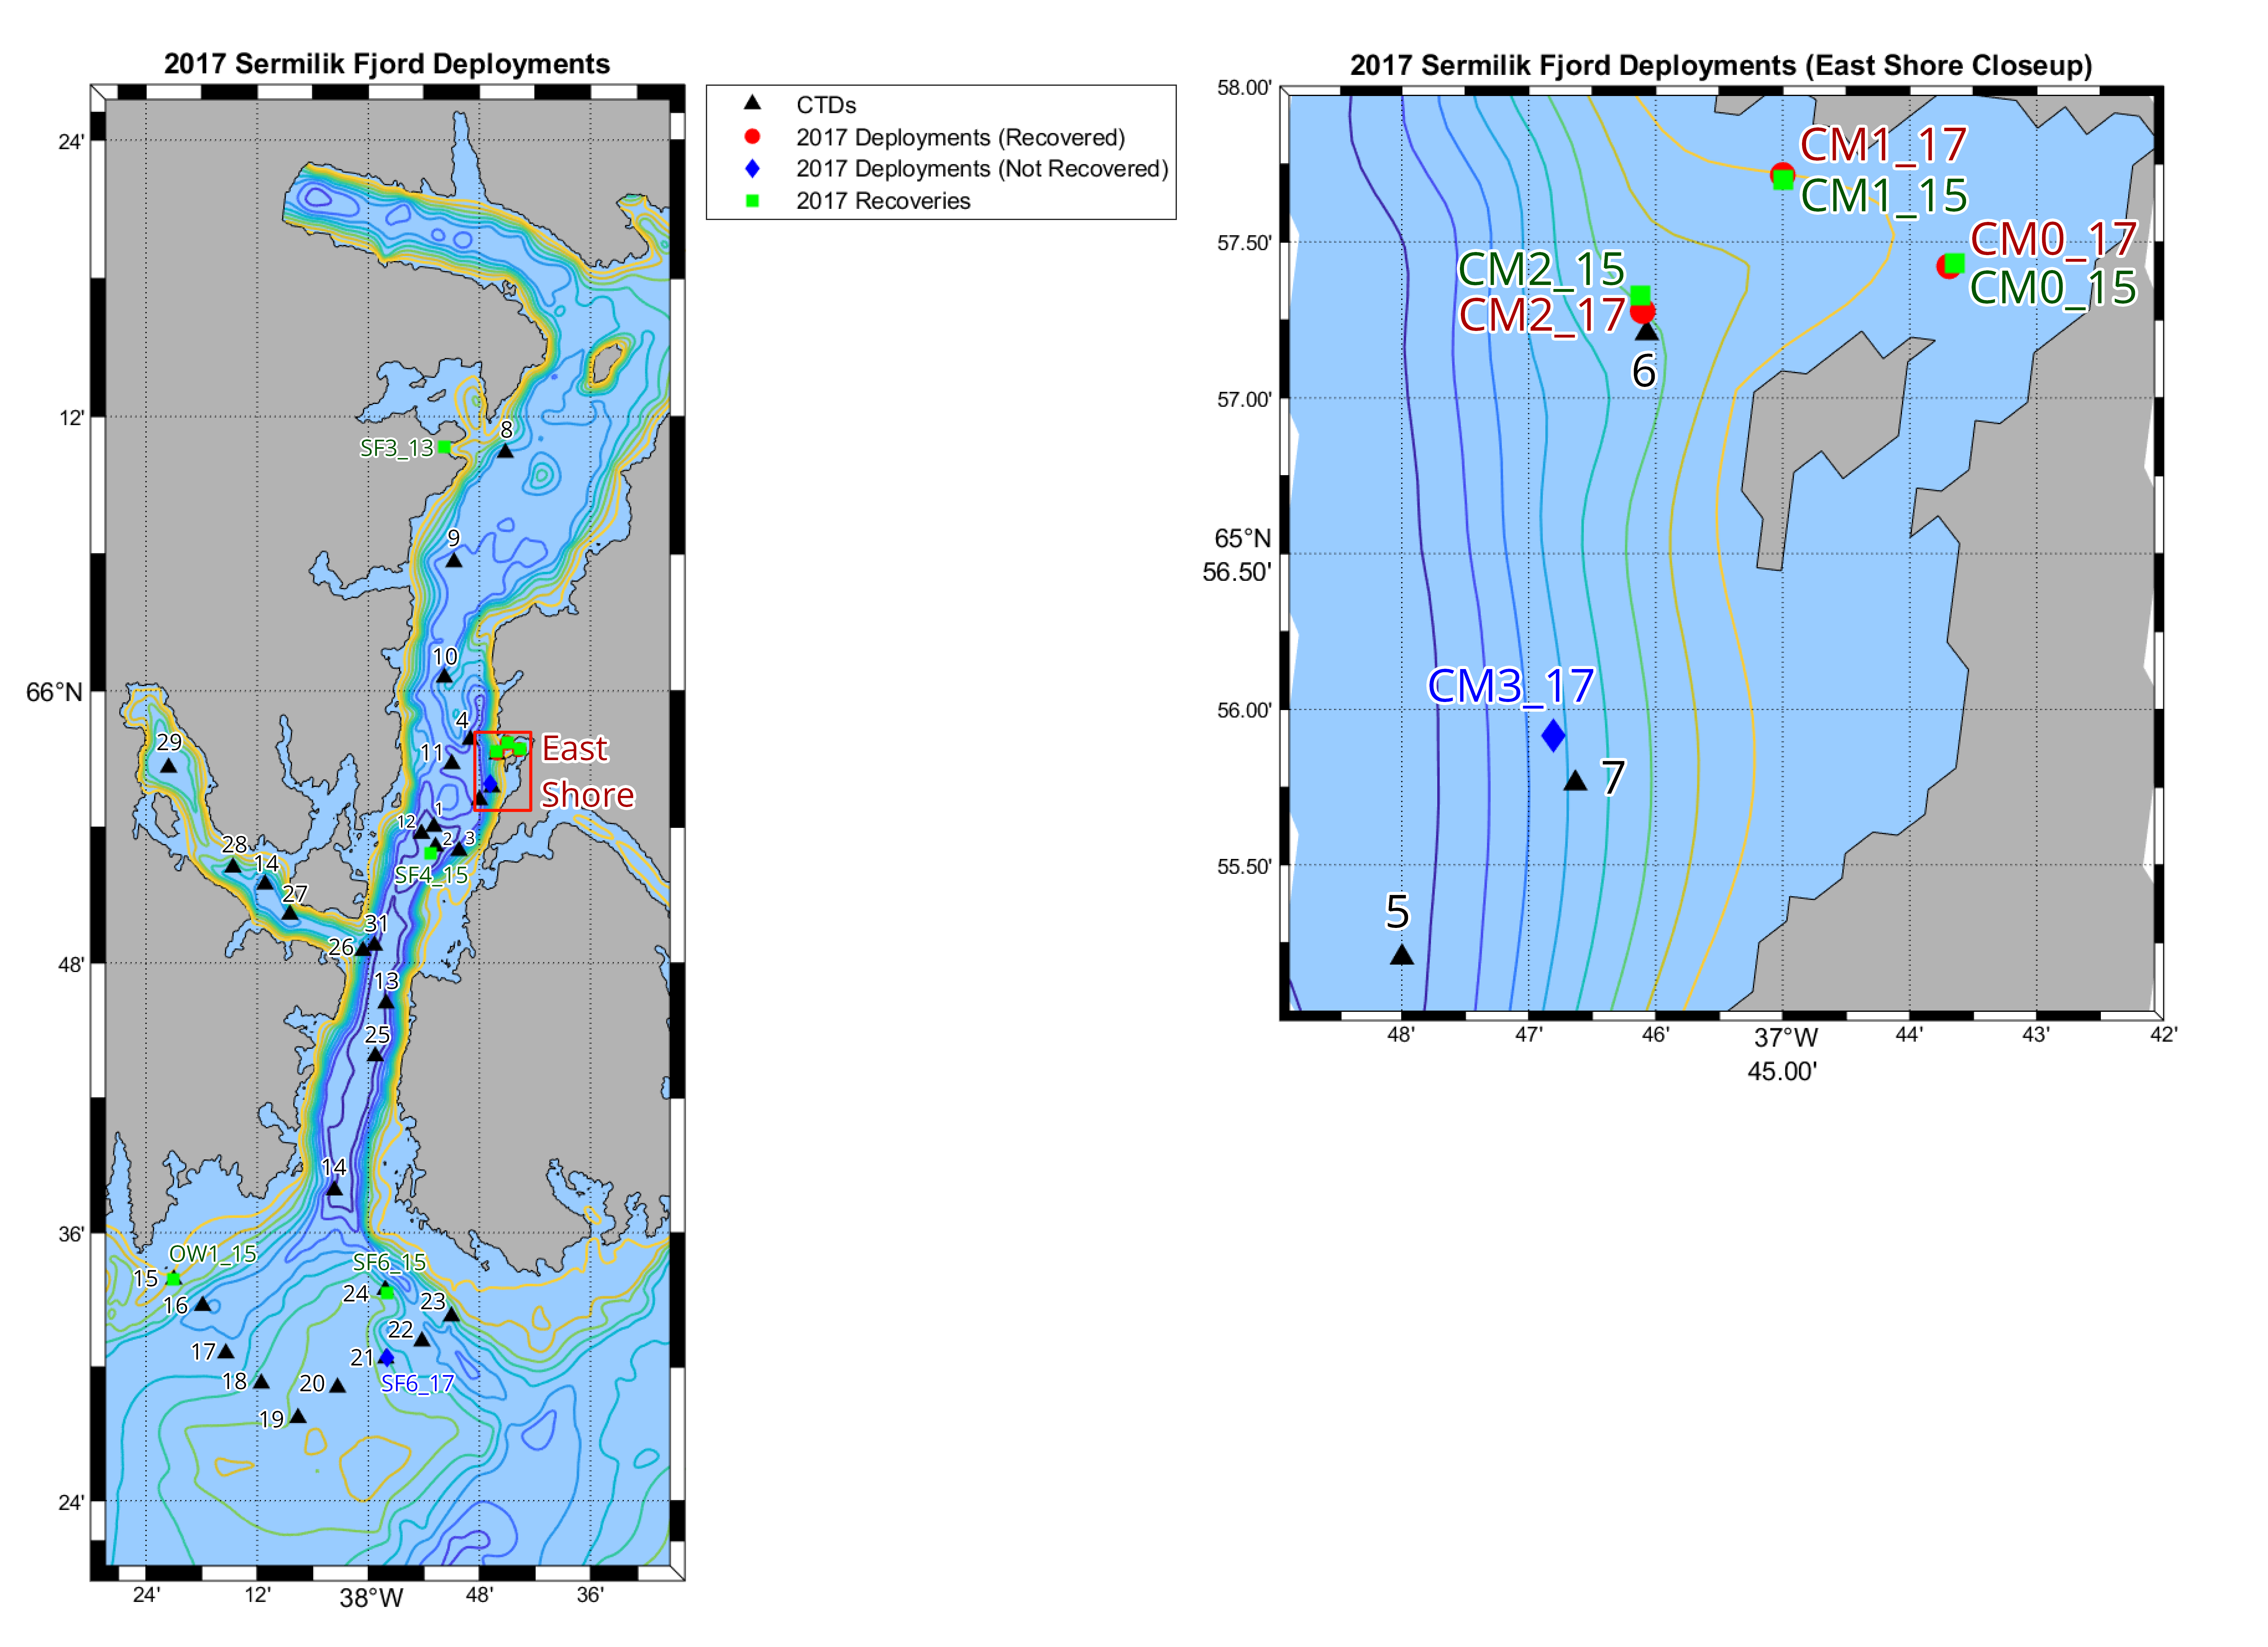
The first major task was to plot the lat/lon locations of moorings, CTDs, and XCTDs for every expedition. I first compiled all the locations from cruise reports and deployment logs onto a spreadsheet, and used the m_map Matlab toolbox to generate a map for the Sermilik region with high resolution coastlines and bathymetry. Once all the points were plotted, I added number labels and other formatting using graphic design software.
The Matlab scripts to create these maps without labels can be found on my Github.
Time Series Plots
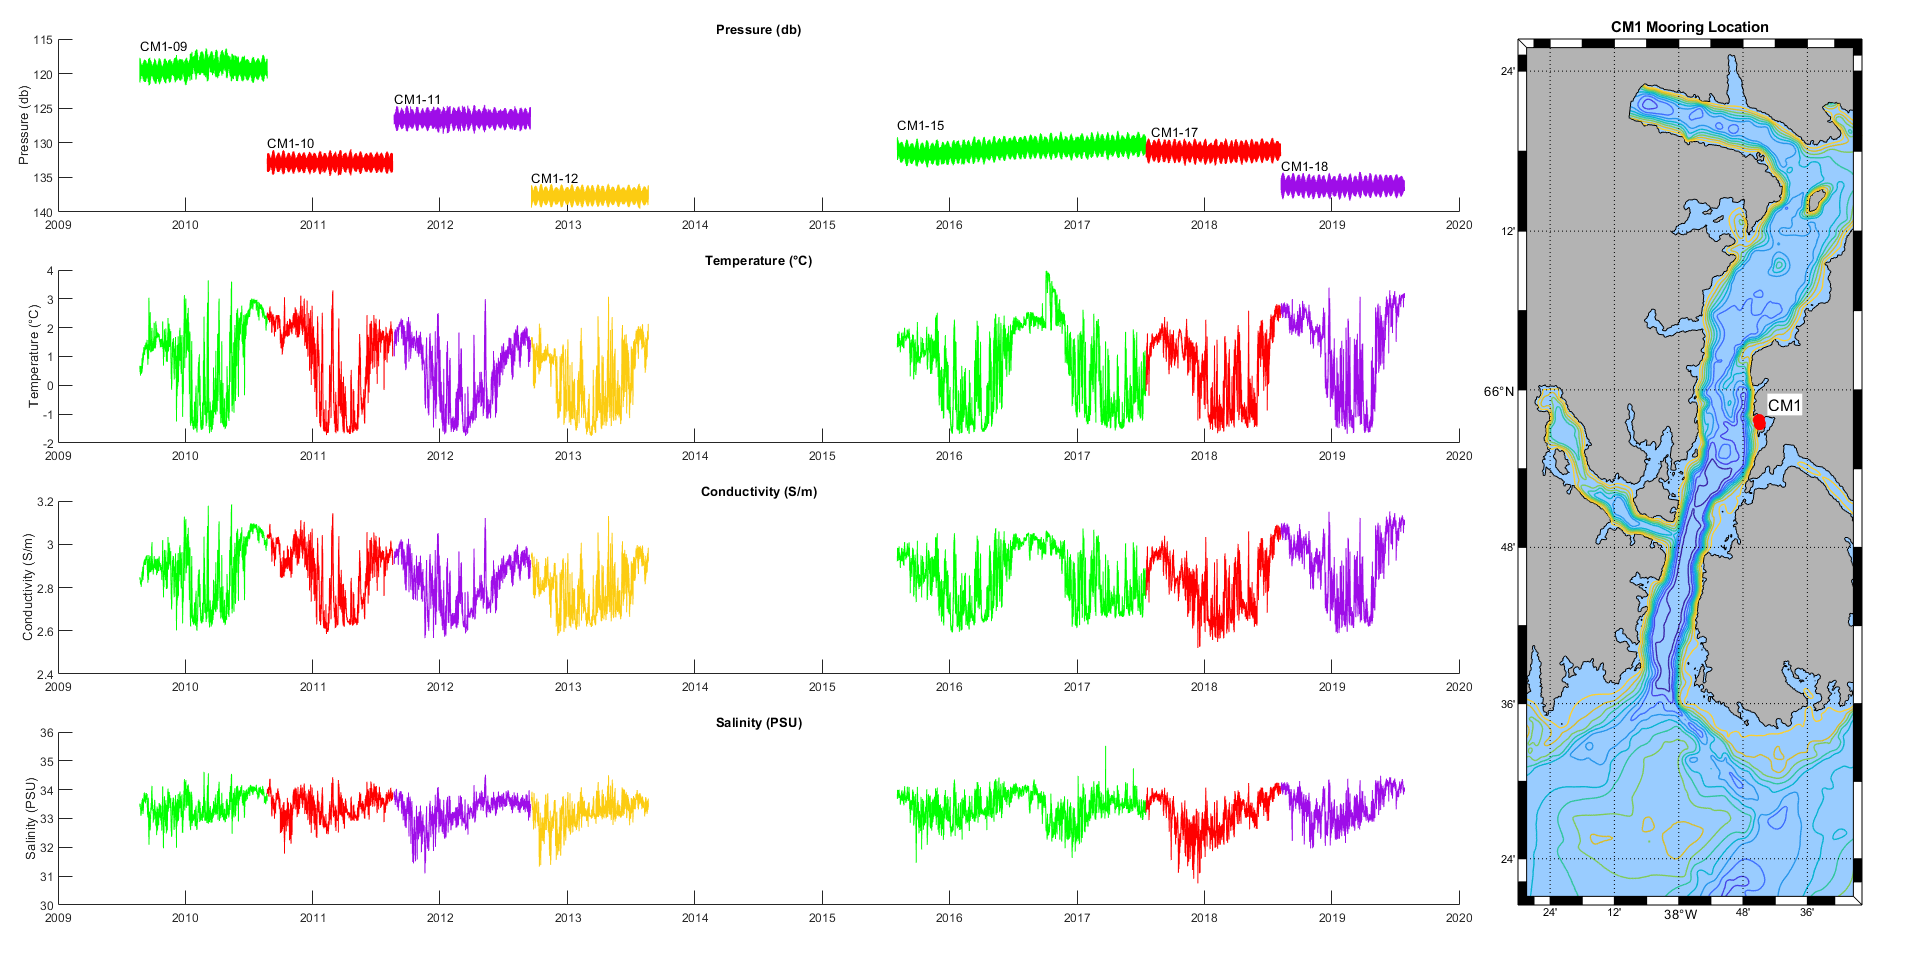
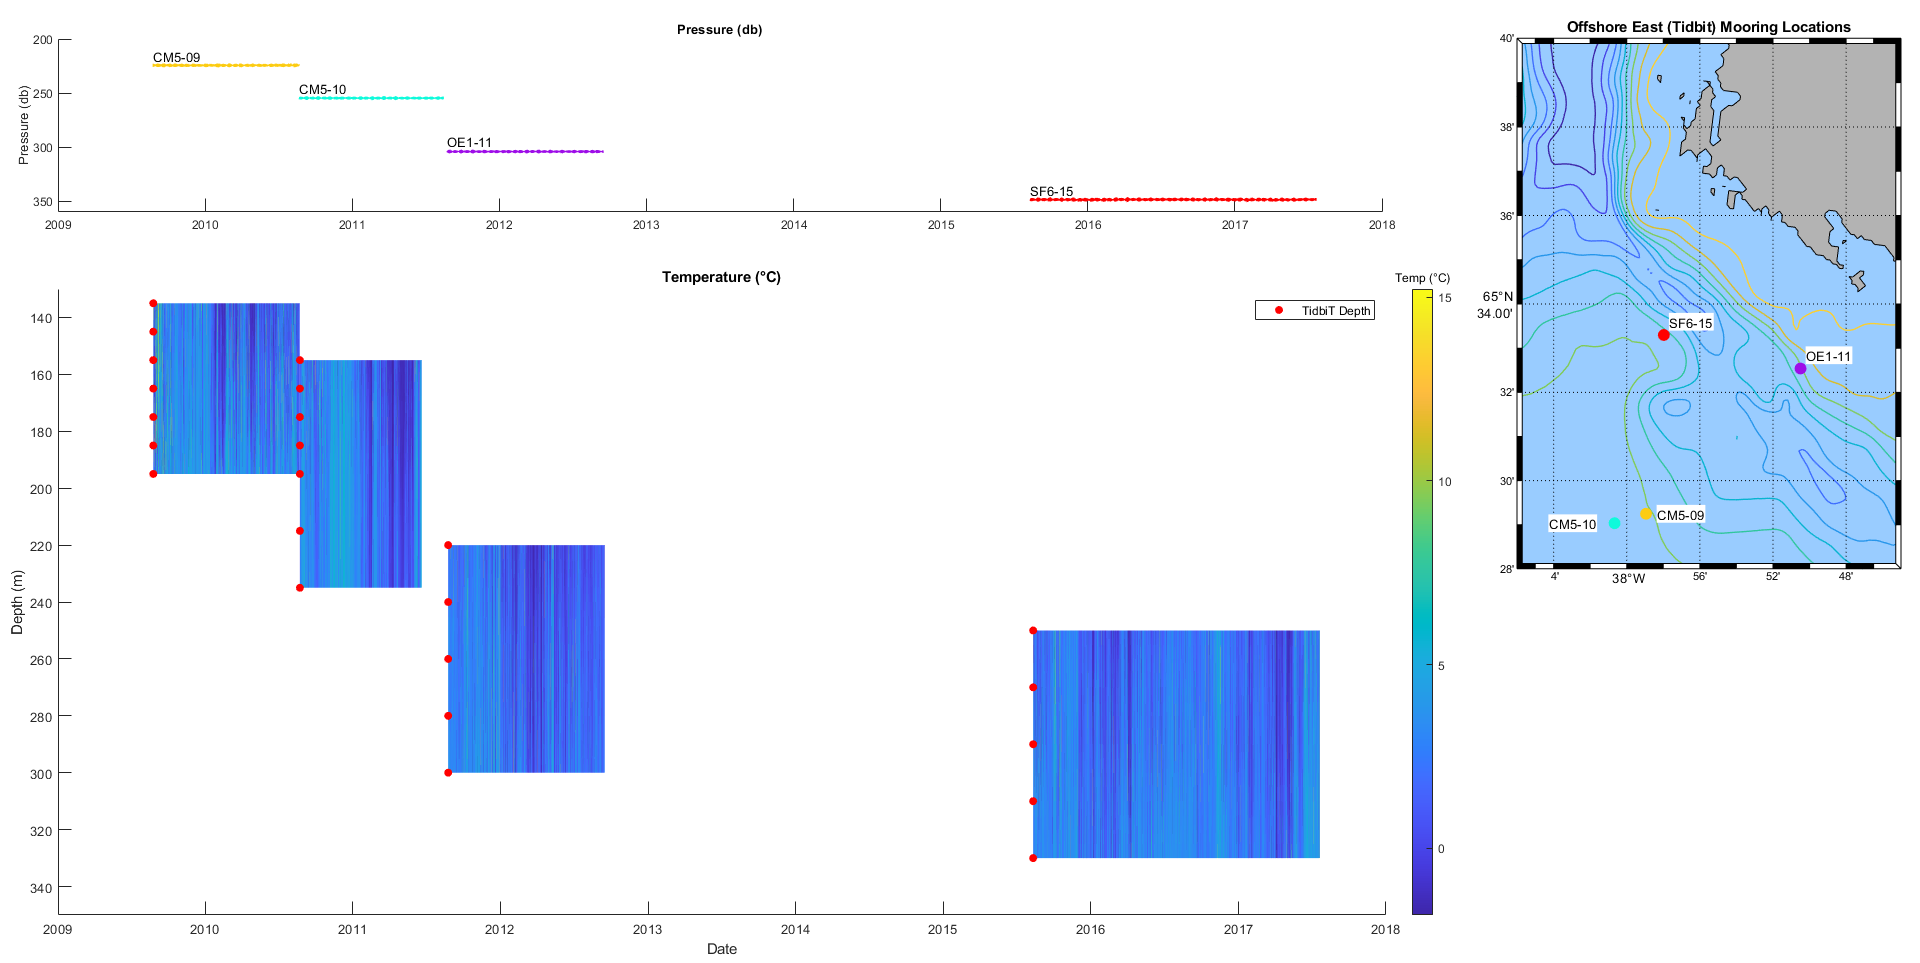
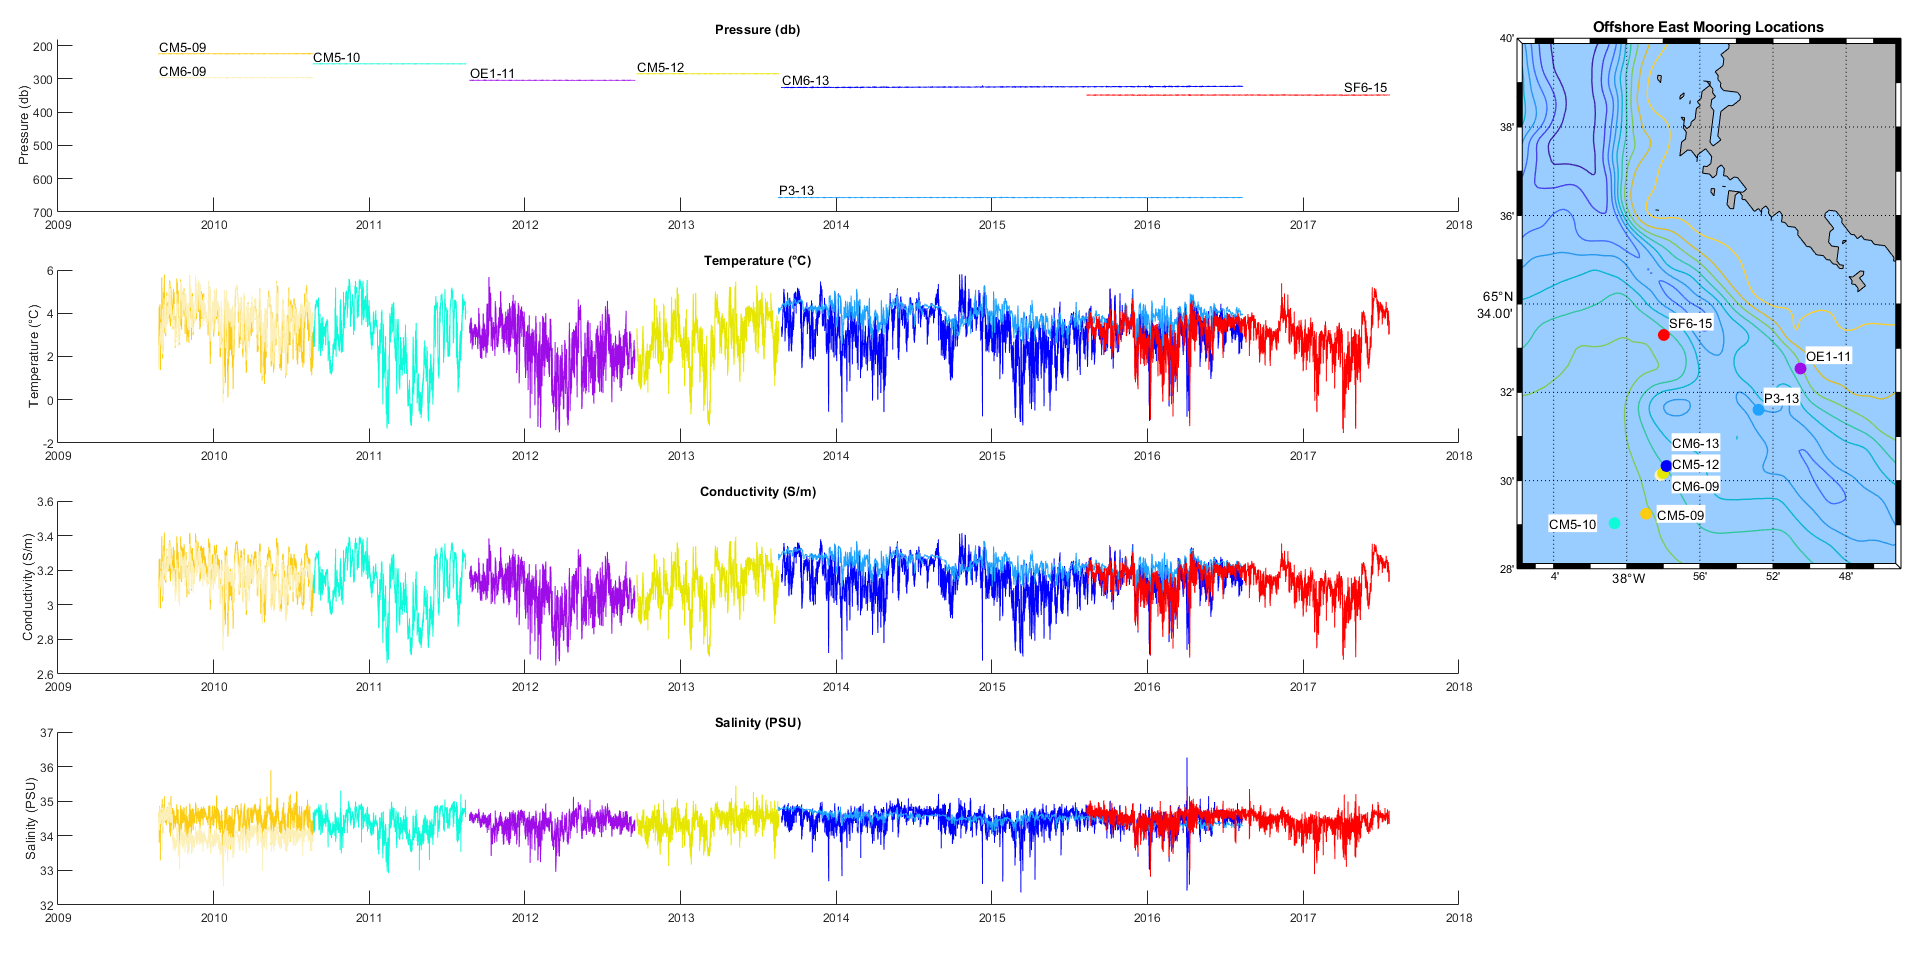
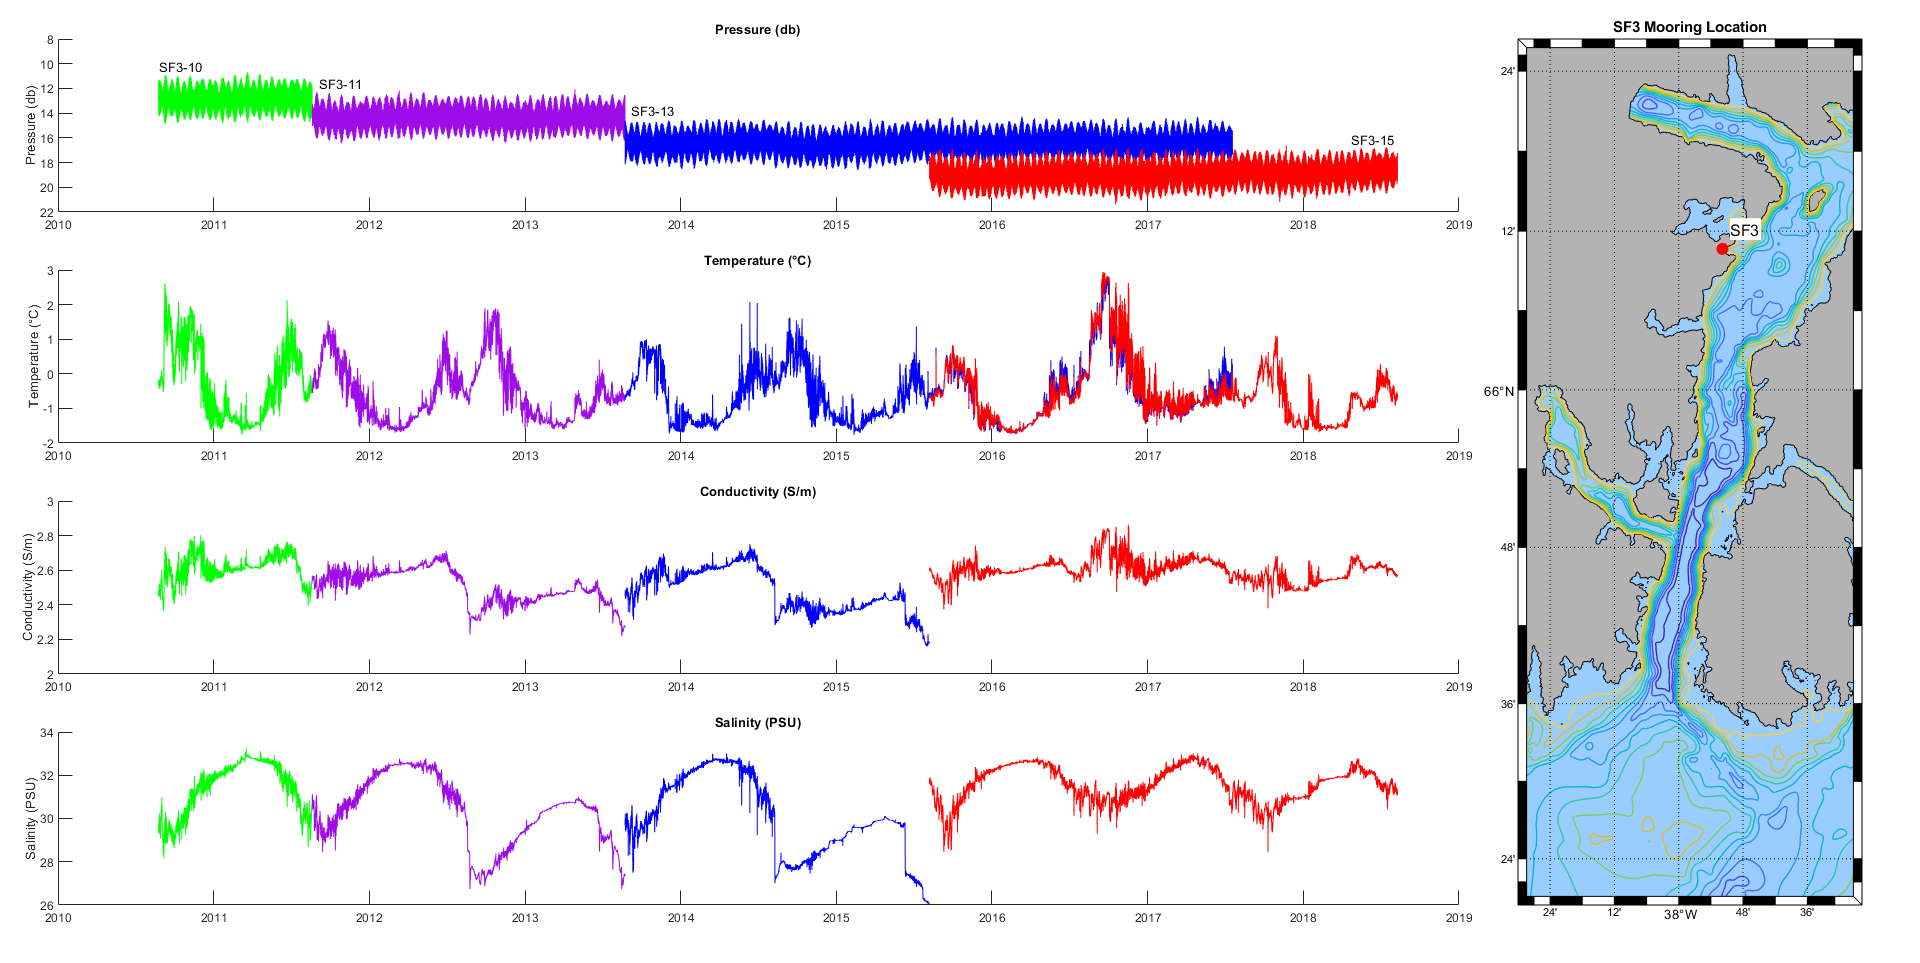
In order to organize and visualize the data, I made time series plots for all available data from each mooring, or series of mooring deployments. In some cases, moorings were grouped together at an area of high interest, so it was best to plot these mooring deployments as one time series representing the water qualities of the region. Some moorings included thermistor strings as a series of TidbiT instruments separated 10 meters from each other, allowing for temperature sections at various depths.
NetCDF Files
To make our data publicly accessible, I am storing each year's CTD profiles in a netCDF file structure with a standardized format. Each year's file will include depth, temperature, conductivity, salinity, conservative temperature, potential density, and absolute salinity, in addition to other variables that may have been recorded that year, such as dissolved oxygen. Most variables are directly recorded by the instrument and then quality-controlled, while some have been derived using the GSW Matlab toolbox.
Once the CTD, XCTD, and mooring data files are all complete, they will most likely be stored in a data repository on the Arctic Data Center. A link will be added here once the project is complete.